Every now and then, especially when emphasizing a technique or strategy that works in both directions, the topic is revisited. Wick hunting is just that, complimented by two others; nothing “goes to the moon” or “goes to zero” . . . that is unless you are a regional bank whose corporate management had as much talent as did Daffy Duck.
When I first wrote and published an article on this subject nature, the old Elmer Fudd / Bugs Bunny cartoon came to mind but remember, I’m hunting “wicks” not “wabbits”. Wick hunting is an important “technical” tool used to position trade. Remember, I’m not as spry as I used to be and trade very little. Once the longer term macroeconomic, geopolitical direction of the market’s expected movement has been determined, it’s just about the only technical “entry” tool relied upon. I’m updating and reposting this article as time-after-time it just works; as they say, “if it ain’t broke don’t fix it.” That’s why I’m using the exact same illustration as when first published. Good visuals never go out of date.
Russell Index Monthly Snapshot
Most of you who are reading this article are day, swing or scalp traders. What I speak of here is applicable to how you trade as well. Over time it’s my belief that some will incorporate more of what I preach into their daily trading plan. Start by assessing the macroeconomic, geopolitical direction of the world, be aware of the current economic calendar then decide whether to look for a short or long entry. This way you eliminate simply ”guessing”; start with a plan of what you expect economically, that’s important.
Start with a predetermined analysis of expectations, essentially narrow what you are “looking” for. That’s important as again, I don’t trade as often as the subsets spoken of above. Position traders identify longer term trends, trades that “last longer” than what most traders seek but again any trader type can trade off wicks. Let’s get back to what this article is about; what is a wick, what do you look for to determine an entry point and what to do when you identify it.
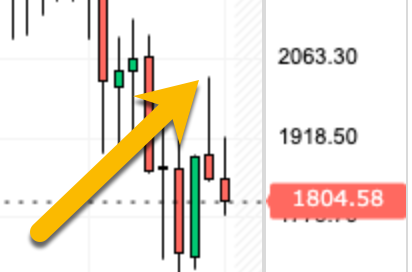
With respect to the above exhibit, perhaps one of the best examples I ever observed, was the Russell Index (the overnight when Trump defeated Clinton in November 2016 was better but I couldn’t find an accurate visual). In October 2021, a little early but as you have discovered, I do that, I went from being cautious to “the sky is going to fall”. Inflation was starting to ramp, novice Robinhood traders still believed we “were going to the moon”, having never experienced anything like the interest rate increases we were beginning to see, so in essence we had the quintessential perfect time to look for wicks to form.
In early November 2021, the Russell Index ran to all time highs. As an experienced historical trader, the first index to succumb to interest rate rises and then collapse is the Russell. I shorted the Russell at 2,442 in what looked like a minimal or “risk free” trade and was right (after incurring a couple small losses in October 2021 (told you I’m usually early)).
Let’s examine what we observed. In addition to the above details we saw a “spike” in the underlying price well above any identifiable moving average. Remember we were looking for a short entry, one that where if we were incorrect and the Index continued higher, the damage would be minimal as we entered the trade at an inflated level. We always look to minimize the risk. Management of risk is an important consideration to trading. Remember, you are going to be wrong and you are going to lose; minimize not only the potential for these loses occurring but the amount of the loss you might be subjected to.
To summarize, evaluate the current macroeconomic, geopolitical scenario the world is currently subjected to then chart your course. If you believe markets are headed lower look for wicks to the upside and vice versa, look for wicks to the downside for markets heading higher. Be patient, especially if you are a day trader. Look for days where the exaggerated direction of the day’s trading is incongruent with your analysis and trend of the market. If the answer to that observation is yes then, look for an entry point and react. Be respectful of the volume; lower volume usually confirms the “wick” will not hold followed by an intraday reversal . . . then act knowing that you have reduced the risk by entering the trade in its artificially inflated direction and the move is unlikely to continue.
Hope you enjoyed this post. I’m just a young 68 years old; my Dad became a broker when I was 13. It’s time for me to ‘give back’ to all of you what’s in my head. It’s not always pretty but it’s based on history . . . and history, unchecked, repeats itself.
Everyone learns at their own pace. If you pick everything up the first time through, great but if not email me at dzimmer@substack.com so we can further help. Thanks again Danny www.mrtopstep.com . . . check him out; he’s worth your “click”.
See you all Sunday night when I look at “The Week That Was & What’s Next”. I’ll be introducing “The Ticker EDU”, a new venture I’ve put together to give back years of experience to those interested in learning. Let me know what you want to learn, I’m all ears.
I’ll end as I began with Elmer Fudd doing his thing . . .


