Edward Snowden is my hero. If that statement doesn’t get me on “Uncle Joe’s” famed watchlist nothing will. In doing, or at least attempting to do the work I do, accurate information is required. I do not count myself as being defined as a true “conspiracy theorist”, at least how it’s reported on the “fake news” channels. No I’m just a free thinking American threatened by what I read and hear about transgressions of those who are running our beloved country while simultaneously keeping their very own checkbook open for unscrupulous deposits. The framers of our Constitution feared this could happen. Too bad they didn’t consider term limits when the Constitution was drafted; that would have alleviated some of the problems we have today. They’re only going to get worse; we need to minimize government’s role in our lives.
When governments fail the “transparency” test, questions about what’s really going on proliferate. When the party in control has the ability to prosecute whomever they choose, failing at times to amicably provide subpoenaed information and simply turn our justice system into a mockery, more people become skeptical. I’m one of them and it’s starting to effect the essence of the very tools I depend on, economic reports; they no longer carry the weight I once granted to them. Perhaps you should too.
In one of my first articles, “Labor Daze Revisited” it was my intention to identify a few of the nuances used by our Federal Government defining the criteria that qualifies a person to be counted. I was thrilled that it received 20 reads; today a little more than two months later, we’re receiving more than 1,000 daily “hits”. Hopefully we’re doing something right, thanks. Click on the link above to read the entire article. In sticking with today’s theme, I wanted to emphasize a few paragraphs. Here we go.
“The unemployment rate measures the share of workers in the labor force who do not currently have a job but are actively looking for work. People who have not looked for work in the past four weeks are not included in this measure.” How convenient; if you have not been looking for a job over the last four weeks you essentially drop out of the calculation significantly reducing the reported number. That just makes absolutely no sense whatsoever; you’re essentially unemployed, you should be counted not hidden in the fluff.
Without a doubt the unemployment rate as headline reported in the United States is grossly underreported. The actual number of unemployed is much higher than our government wants you to believe. Maybe there should be another number including (1) living in my parent’s basement; (2) the homeless living on our sidewalks; (3) drug dealers; and (4) anyone operating under the radar failing to declare their incomes or paying taxes. Maybe even start counting illegal immigrants; wait, they’re the ones who are actually working.
A reported unemployment rate under 4% is statistically unrealistic but based upon the Federal Reserve and how they define recession and the like, they base their decisions in what amounts to be a “pie in the sky” number. If this calculation is skewed, in one direction or another, what other reported numbers are equally flawed and why.
How We Measure Inflation
The actual percentage composition of the CPI in the United States is based on the expenditure patterns of urban consumers. It’s updated periodically by the U.S. Bureau of Labor Statistics (BLS). As of September 2021, the percentage composition of the CPI in the United States was as follows:
Housing: Approximately 42% of the CPI. This category includes rent, owner's equivalent rent, and other housing-related expenses like utilities, furnishings, and maintenance.
Transportation: Around 16% of the CPI. This category covers vehicle costs, fuel, public transportation, and vehicle maintenance.
Food and Beverages: Approximately 14% of the CPI. This includes food at home, groceries, and food away from home, restaurant meals.
Medical Care: Around 8% of the CPI. This category includes healthcare services, prescription drugs, and medical insurance premiums.
Recreation: Approximately 6% of the CPI. This category covers expenses related to entertainment, recreational activities, and durable goods like computers and TVs.
Education and Communication: Around 6% of the CPI. This category includes tuition fees, school supplies, telephone services, internet access, and postage.
Apparel: Approximately 3% of the CPI. This category includes clothing and footwear.
Other Goods and Services: Around 5% of the CPI. This category encompasses various items, such as personal care products, tobacco, and miscellaneous expenses.
I’m beginning to wonder not only if this information is subject to alteration by “the powers that be”, I’m starting to question the validity of how it’s broken down as well as how it reflects actual patterns in the United States. After all, one of the components in the food category is Oreo cookies; how many of you regularly buy Oreos?
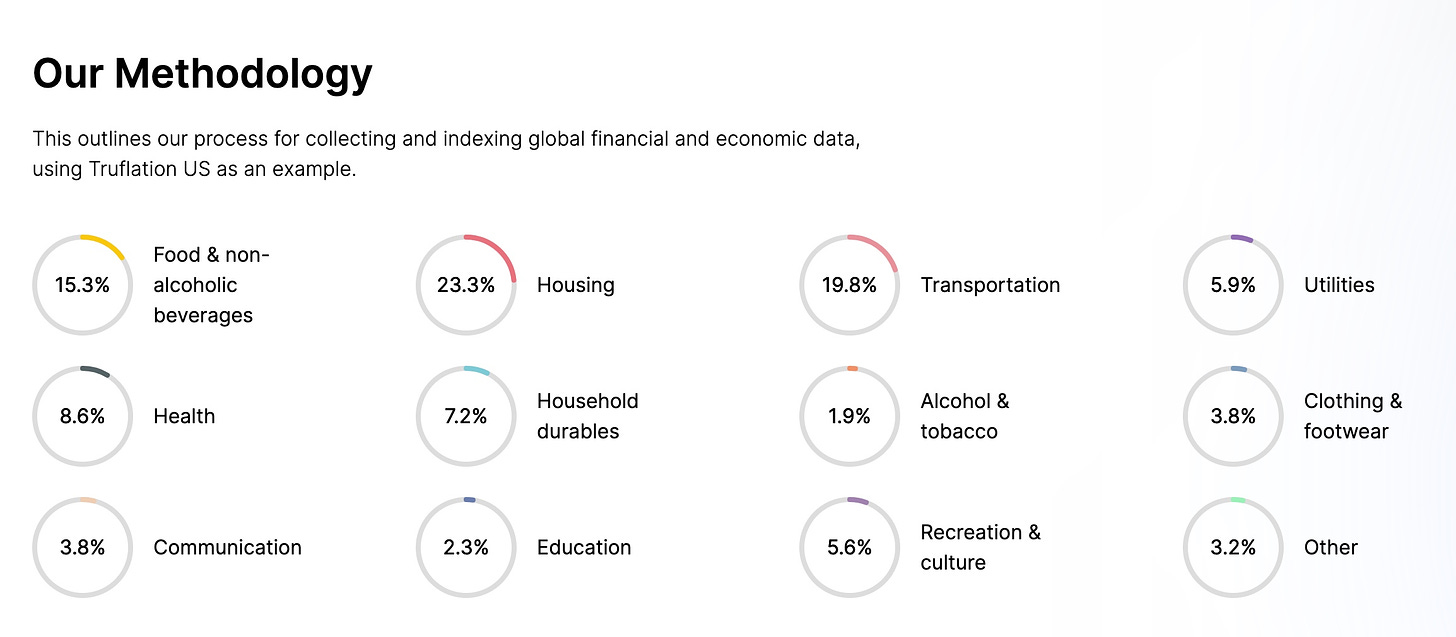
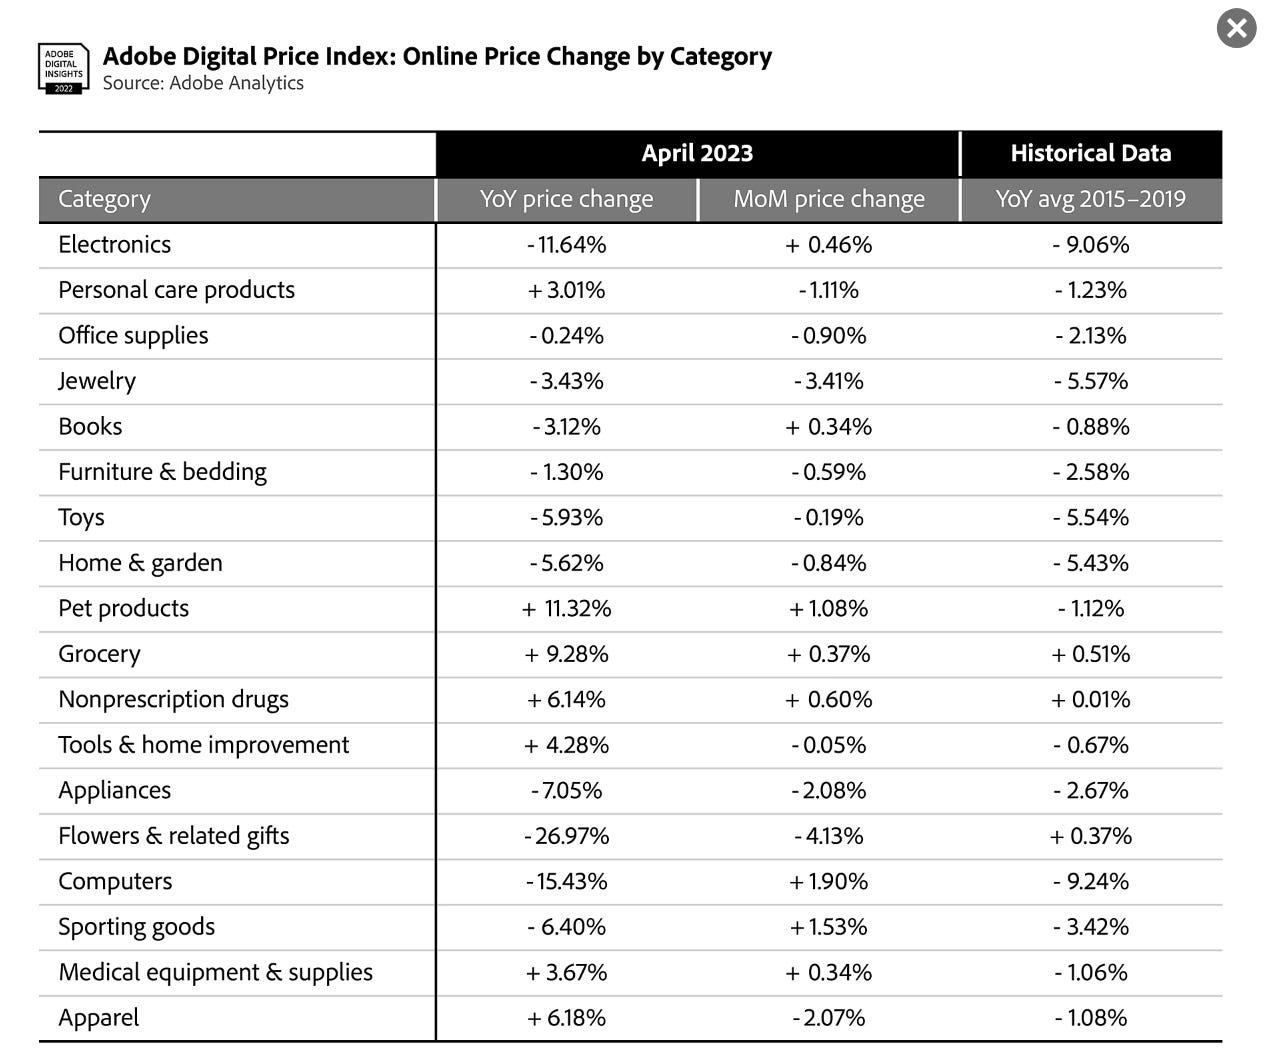
Over recent weeks I’ve introduced a couple new “inflation” calculators to you. While I’ll dwell on Truflation today, check out the Adobe Digital Price Index as well. If there is one I’d like to see created it would be one from Amazon as they have all of the data and I’m certain they use it internally. Back to the comparison.
The above graphic and the September 2021 percentage breakdown of the CPI give us the following:
Category - Truflation / CPI
Housing - 23.3% / 42%
Transportation - 19.8% / 16%
Food & Beverage - 15.3% / 14%
Medical Care - 8.6% / 8%
Recreation - 5.6% / 6%
Education & Communication - 6.1% / 6%
Apparel - 3.8% / 3%
Other - 18.2% / 5%
Given some categories reported in Truflation are subsets of the CPI as reported, when you add Utilities (5.9%) & Household Durables (7.2%) back into the “Housing” category some of the almost 20% discrepancy disappears. If you add Alcohol & Tobacco (1.9%) back into the Food & Beverage category the difference increases. In my opinion, it is not as much the differences rather how the data is collected then reported. In any case it’s nice to see challenges as to how the CPI is collected and reported begin to arise. It would be even better if Powell and others started to take them into consideration.
As illustrated below, the Adobe Digital Price Index further breaks down categories. It might be a good idea to do the same as they calculate their results.
Back to transparency and the discerning societal change relating to whether or not we believe what we’re told. How recently politically motivated judicial action, or inaction as it may be are creating a mistrust of our elected officials is worrisome. I like living in a country where freedom of speech exists, right? Certainly so for the “party” that’s in power of the judiciary but equality as we know it is waning. Don’t believe me, just turn on “fake news” and decide for yourself.
Hope you enjoyed this post. I’m just a young 68 years old; my Dad became a broker when I was 13. It’s time for me to ‘give back’ to all of you what’s in my head. It’s not always pretty but it’s based on history . . . and history, unchecked, repeats itself.
Everyone learns at their own pace. If you pick everything up the first time through, great but if not email me at dzimmer@substack.com so we can further help. Keep your eyes tuned to our upcoming launch of Tradrr . . .
I love “The Clash” and especially this one, “I Fought The Law” . . . and the law won. If for some reason my postings are being followed by people Snowden warned about let me say,”hi, what took you so long”. I’ve been of this ilk since the Vietnam War. I was right then and I’m right now. Fight for what you believe in; above all the right to free speech and what the framers gave us in the Constitution. A living document almost 250 years in existence, albeit amended from time to time, still works. Protect it and again, say thanks to Snowden. It’s a problem when your fear of your own government is greater than your fear of the effects of AI. All things considered, what don’t they know; I assume very little.


