Placing a national holiday on a “Wednesday”, right in the middle of the week, at first did not make much sense, especially during the start of summer. Maybe we needed a break, a little time to gather our thoughts.
I’m always listening, reading, and thinking so the “extra” day was acceptable. Much to my surprise, many of those I followed agreed. There were many articles, opinions, and various statements published last week. Their contents were consistent, everyone sees a “top” in this market for one reason or another.
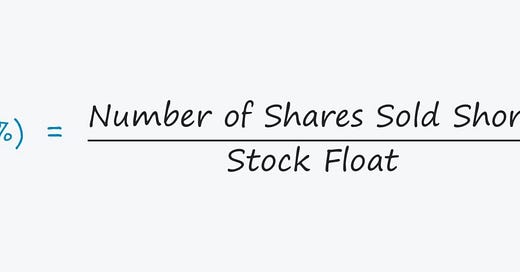
The “big boys” are watching “short interest” decline, a reliable strength indicator that supports the upside. Like all who post anything here or on LinkedIn, they’re worried about the “breadth”, the fact that the increased index prices are the result of a couple of securities. Regardless, no one believes this market goes higher.
I tend to agree with them but who am I? I’m just a boring, more conservative than not position investor, trader, and hedger. It’s not that I’m changing. I’m not. While I will look at various sectors to highlight from time to time, my overall strategy is interest rate-based. That’s not going to change, You’ve followed me, I don’t need to restate it.
But there were a few articles and thoughts out there that we should consider. They do make sense. Let’s take a look but always remember, it’s summer, there’s an important political debate scheduled this week and Independence Day celebrations will follow. I like sitting on my hands and other than a little rebalancing and reacting to the news, be it “fake” or not, I’m all ears and eyes and you should be too.
Berenberg Says The NASDAQ Has Topped
Berenberg analysts issued a sell signal for the tech-heavy Nasdaq 100, noting that the 14-day relative strength index (“RSI”) has breached 80 for the fourth time in five years, reaching its highest level in that period at 81.6. RSI is a momentum oscillator used in technical analysis to gauge whether a security is overbought or oversold. It has been a reliable indicator for adjusting Nasdaq 100 risk over the past few years.
Driven by Nvidia (“NVDA”) and the Magnificent 7 group, the Nasdaq 100 has returned 18.8% year-to-date. Most of this return happened since the RSI fell below the 30 level on April 19. An 80+ RSI suggests investors bank gains and position for consolidation.
The investment bank identified three previous instances in the last five years where the Nasdaq 100's RSI breached 80, in December 2019, January 2020, and September 2020. The average maximum drawdown within the six months following was -22.9%. Again, this suggests that investors should turn their hazard lights on at this point.
Wells Fargo Agrees
Wells Fargo thinks investors should reduce their exposure to “overvalued” technology stocks. The investment bank points to the narrow breadth of the current market rally, driven by a small number of big-cap tech and communication services companies.
Just a few tech giants are responsible for most of the S&P 500 Index's gains this year. Data from Bloomberg shows that the top five contributors accounted for nearly 58% of its gain through May 31, 2024. That means the remaining 498 companies contributed little more than 42% to the overall return. The average return of the top five has been 40.8% while the rest of the index members averaged less than 5%.
Wells Fargo also noted the disparity in performance between different market indices. The Russell 2000 Index underperformed the S&P 500 Index through May. Specifically, the small-cap index rose 2.1% compared to the S&P 500’s gains of 10.6%.
In addition, only 36 out of 124 sub-industry groups in the S&P 500 have outperformed the index year-to-date. Breadth of this market rally is limited. The bottom line is, from a market-breadth standpoint, an analysis of the performance data through May shows a narrow array of stocks driving the SPX to new record highs.
Warren Buffett Is On A Buying Binge
Warren Buffett has been aggressively buying Occidental Petroleum (“OXY”) over the past nine trading sessions, increasing its stake to nearly 29%. The company revealed it made three separate purchases of Occidental between June 13th and 17th, averaging just under $60 per share, with a total investment of approximately $176 million.
Buffett's confidence in Occidental is further underscored by his existing warrants to buy an additional 83.5 million shares at a discounted price of $59.62 per share, below the current market price of $61.26 (as of Wednesday's closing).
The news of Buffett's increased stake sent Occidental's share price higher. This rise could be the beginning of a sustained upward trend for Occidental. It's worth noting that Occidental's share price had fallen 15.4% from its April 11th peak of $71.18 by Monday's close, before news of Buffett's additional purchase became public.
However, the stock showed signs of stabilization in early June, finding support just below $60. This stability influenced Buffett's decision to increase his stake, suggesting he believed the stock had reached an attractive buying point.
Analysts are more optimistic, with an average target of $71.96, which translates into a potential upside of 17.5%. However, the very fact that Buffett owns the stock gives it an aura and premium that could carry it higher than we think. Warren Buffett's recent purchase of Occidental signals that the stock's recent slump is ending, aligning with other positive indicators. I bet his chips are on Trump winning as well.
Someone Said To Buy Bonds
U.S. equities have had a stellar run. Despite numerous global risks, investor sentiment for American shares is resilient. The question will always remain. When is it timely to take some of the winnings and redeploy them to other asset classes?
There are countless ways to engage in opportunistic portfolio rebalancing analytics. A good way to start is by profiling “performance”. For U.S. equities, the case for tamping down expectations looks persuasive. Given that expected returns evolve inversely with trailing performance, recent history provides a baseline for thinking about risk.
The view that the bear market for bonds is over is attracting even more attention. The future is uncertain. One can argue that the foundation is in place for a solid round of portfolio rebalancing. Consider how U.S. stocks and Treasuries compare over the past three years. The divergence is a chasm.
The worst for the bear market in bonds has passed. We’ve seen the peak in yields and bonds are now back to having a deserved place in a multi-asset model. Treasuries are starting to show an upside bias lately. It’s plausible that we’re in the early stages of an extended rebound. The odds are beginning to tip in favor of a bullish view for bonds.
You can’t make reliable near-term forecasts based on the “basic analysis” but you can weigh the implied odds for what may come next. But let’s not forget that the market is convinced that several factors have aligned so that U.S. equities deserve to be favored over most other asset classes. When, or if, that sentiment bias will change is anyone’s guess but from my perception, the change has begun.
“Monday Monday” was one of the songs made famous by The Mamas & The Papas. It is going to be an interesting week. Everyone suggests that the stock market exhausted itself. Quite often tops in the market are not that easy to identify. Stocks have a mind of their own but this time may be different. There’s a new player in town, bonds. It has been quite some time since investors considered making bonds a part of their plan. It makes sense in today’s market. With the potential of interest rates declining, the price of bonds should appreciate. A portion of bonds in your portfolio just makes sense.


