Nice week down here in Texas. Had the grandchildren over forever a couple days, It’s amazing how much work around the yard they can get done. Amazing how much they can eat as well but nothing better than the smiles on their faces; especially when they get paid. Now that’s a history I adore repeating and certainly one I hope many of you are experiencing as well. OK, back to Sunday Night and a follow up of why this week is going to be interesting.
It’s not going to arise from economic reports, Fed speak or slip and falls, the latter of which being the most likely. It going to come from what was posted yesterday, simple “wick” trading. Set-ups like we have on our plate today do not happen often. They are not only good for making money, they’re good to teach and learn from.
Forgive me if you have read this before but given yesterday’s dissertation and what’s been identified as the best “wick’ hunting opportunity identified in quite a while, it’s right to drill it into that “space between your ears”.
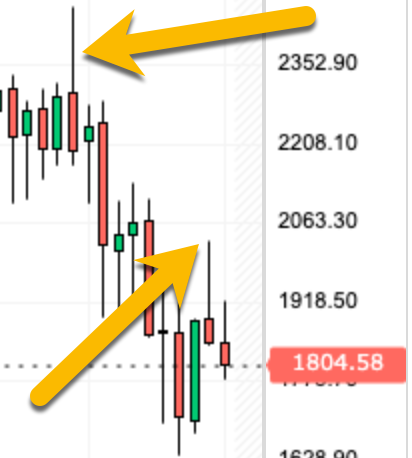
Wick hunting is an important “technical” tool used to position trade. Remember, I’m not as spry as I used to be and trade very little. Once the longer term macroeconomic, geopolitical direction of the market’s expected direction is determined, it’s about the only technical “entry” tool I rely on. There’s very little on the economic indicator side this week. Coupled with the debt crisis resolution, known better as “kicking the can down the road”, the only bit of news relates to whether the Aussies will hold rates at 3.85% and OPEC and they’re not making any significant changes. While the Federal Reserve has the firepower to raise rates another 1/4 point, to appease the financials, they just might pause, in reality for quite some time to come but few will take that into consideration. A pause will send the “newbie” Robinhood traders into a buying frenzy furthering my belief that this market is topping out, especially the Russell 2000 Index. That’s why I’m using the exact same illustration as I did when I first published an article on this topic. Good visuals never go out of date.
Russell Index Monthly Snapshot 2021 - 2022
Many of you who are reading this article are day, swing or scalp traders. What I speak of here is applicable to how you trade as well. Over time it’s my belief that some will incorporate more of what I preach into their daily trading plan. Start by assessing the macroeconomic, geopolitical direction of the world, be aware of the current economic calendar then decide whether to look for a short or long entry. This way you eliminate simply ”guessing” or looking at a chart or graph that by the time it’s displayed is more than likely dated; start with a plan of what you expect economically, that’s important.
With respect to the above exhibit, in October 2021, I went from being cautious to “the sky is going to fall”. Novice Robinhood traders believed we “were going to the moon”, having never experienced anything like the interest rate increases then just beginning to surface. Similarly today, regardless of what the Federal Reserve does in the coming weeks, higher interest rates are here to stay for quite some time.
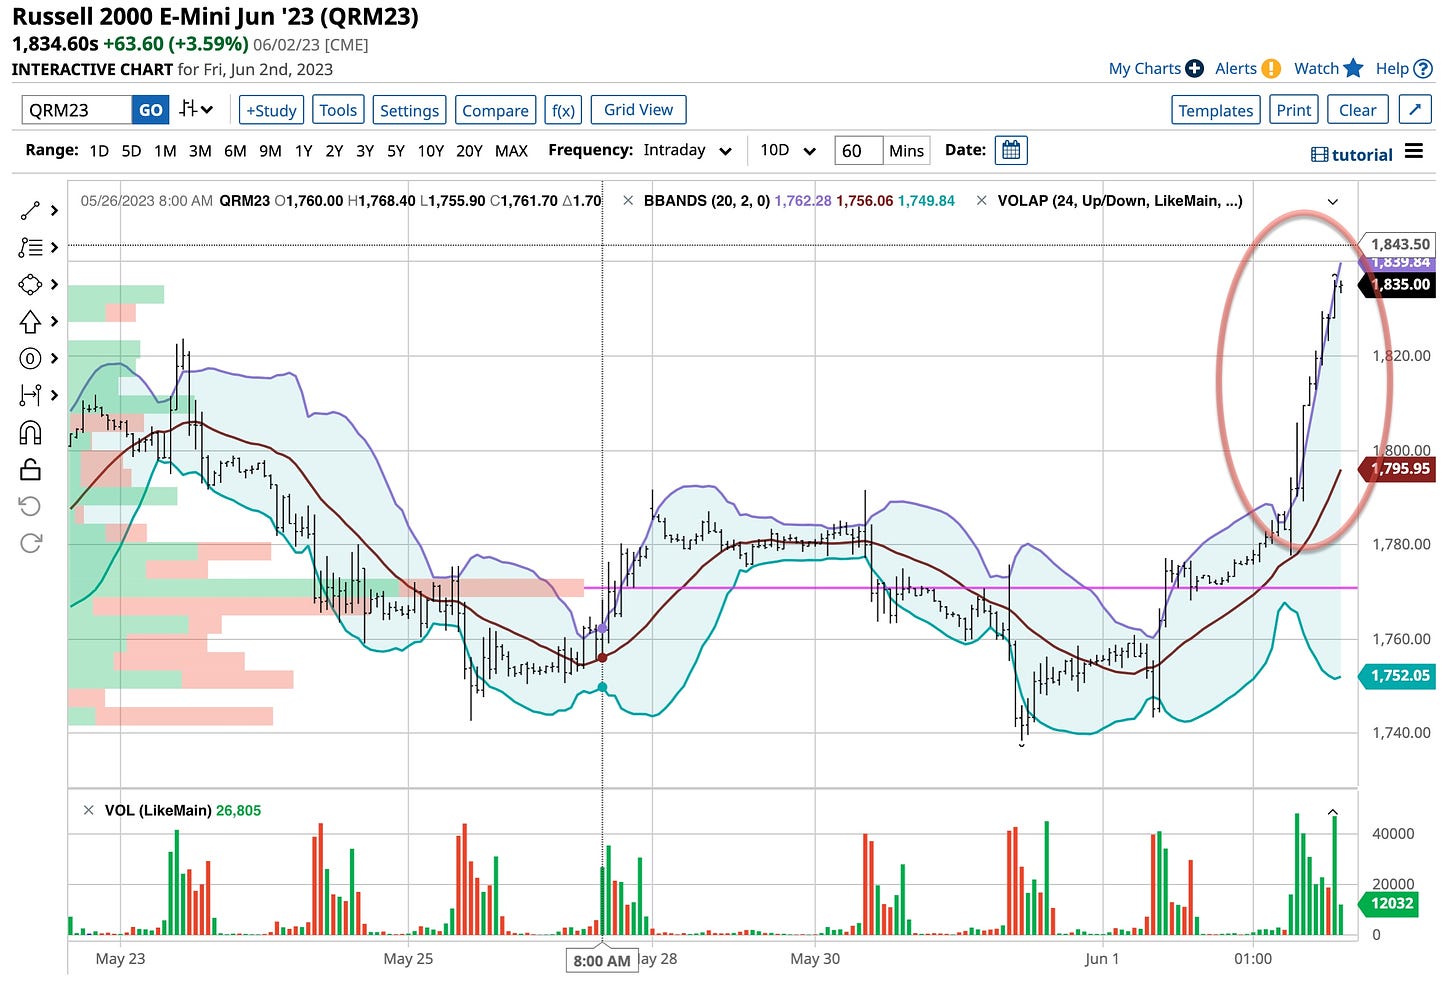
Management of risk is always an important consideration. You are going to be wrong and you are going to lose. Minimizing not only the potential for these loses occurring, but the amount of the loss you might be subjected to, is critical. That’s why it’s best to be patient, wait for the optimal time to open your position. That’s why I waited for the “charts and stars” to align at higher levels as illustrated below and in yesterday’s post. I could be wrong but if I am, I’ll be wrong at a better price point than if I had entered earlier.
Last Week’s Parabolic Russell 2000 Index
To summarize, evaluate the current macroeconomic, geopolitical scenario the world is currently subjected to then chart your course. Be patient, look for exaggerated moves in the opposite direction of your analysis and trend of the market. Be respectful of the volume and the breadth, always and today, the volume is low and breadth is basically nonexistent.
Do any of you remember the “odd lot” indicator? It seems to have gone by the wayside post entities, like Robinhood working with The Citadel, consolidating small, less than 100 share orders. I loved that indicator. The smaller investors, like they are today, were usually wrong. I’ve been searching for information that could be reconstituted into an indicator of that nature but even with the resources of AI have come up empty. If any of you out there know where I can find and harness the data, please let me know.
Hope you enjoyed this post. I’m just a young 68 years old; my Dad became a broker when I was 13. It’s time for me to ‘give back’ to all of you what’s in my head. It’s not always pretty but it’s based on history . . . and history, unchecked, repeats itself.
Everyone learns at their own pace. If you pick everything up the first time through, great but if not email me at dzimmer@substack.com so we can further help.
So what the hell, let’s give U2 it’s due, after all it is Sunday. “Sunday Bloody Sunday” is on the hit list. Keep patient, wait for your stars to align and remember, the market is alive, has a mind of it’s own and a heartbeat to match. If you’re right, ride that horse; if not get off and remount again.


